NER 2024 Sustainability Report
New Energy Risk's driving motivation is the enablement of a more sustainable future. Our technology performance insurance solutions are designed to provide the necessary risk transfer for markets to adopt the emerging technologies that are essential to that goal, and we measure our success accordingly. We are pleased to release our 2024 Sustainability Report detailing the measurable impact of our customers. The latest report from our CEO, George Schulz, Chief Actuary and Managing Director of Underwriting Development, Sherry Huang, Senior Scientist, Shawn Lee and Managing Director of Business Development, Richard Riley details the results of NER’s client portfolio.

Split-Form Contracting: A Project Contracting Form Extolled by Experts, But Can Investors and Lenders Accept It?
By Brad Price - Managing Director of Technical Due Diligence
New Energy Risk helps accelerate the commercialization of industrial technologies that are solving global challenges. We routinely see that one of the biggest challenges to developing a bankable project is the contracting structure for engineering, procurement and construction. Conventional wisdom holds that a lump-sum EPC contract is superior, but the data presents a challenge to this assumption.
 This blog post comes with a book recommendation – Ed Merrow, the Founder and President of Independent Project Analysis (IPA), recently published a great book called “Contract Strategies for Major Projects: Mastering the Most Difficult Element of Project Management.” I highly recommend this book to anyone interested in gaining new-found, evidence-based understanding of contract strategies for industrial projects that challenges conventional wisdom.
What is split-form contracting?
Ed defines split-form contracting as a structure that separates the construction activities (the C of an EPC contract) from the engineering and procurement activities (the E and the P) by using separate firms and contracts [i]. Under this structure, the EP firm has no role in construction, other than to field design clarifications, and performs no construction management activities. In nearly all case, EP activities are undertaken by the same firm as the Front-End Engineering Design (FEED) performed during project development, prior to the execution of the EP contract. According to Ed, the split form approach accounts for almost 30% of industrial projects [ii].
Split-form contracting can be performed on a lump-sum basis for each contract (lump-sum EP and lump-sum C), which has the potential to provide the contractual cost certainty that project finance transactions require – which is of great interest to NER and anyone aiming to conduct a project financing.
The Strengths of Split-Form Contracting
Ed uses the extensive IPA project database to compare the many different forms of contracting, such as lump sum EPC; engineering, procurement, and construction management (EPCM); reimbursable EPC (an EPC contract reimbursed on a time and materials basis); and split-form contracting. What stands out from the data is the cost competitiveness of the split-form contracting method. While lump-sum EPC contracts are generally lauded as the gold standard in the finance community, in fact a properly executed split-form contracting structure can deliver significant advantages [iii]:
- Split-form contracting is on average approximately 7% less costly compared to a lump-sum EPC contract. Reimbursable EPC and EPCM contracts are more costly than the lump-sum EPC approach, by approximately 13% and 7%, respectively.
- Split-form has less cost variability, with a standard deviation of approximately ±13% compared to lump-sum EPC (±25%), reimbursable EPC (±30%) and EPCM (±25%).
Split-form contracts do demonstrate slightly higher final cost growth compared to the original estimate compared to lump-sum EPC contract (4% vs. 1%) but the original cost estimate is on average so much lower that the overall 7% cost advantage mentioned is maintained. This cost growth should be handled with a slightly larger project contingency. For reference, the average cost growth for reimbursable EPC and EPCM structures are 7% and 6% respectively.
Regarding schedule, lump-sum EPC and split-form with lump-sum EP with lump-sum C take about 4% longer than reimbursable EPC and EPCM [iv].
Ed cites many reasons for the advantages of split-form contracting. One is that it prevents construction from starting before the engineering is completed. When engineering is late under a lump-sum EPC structure, the firm is highly incentivized to start construction despite not being ready [v]. This is because there is oftentimes a milestone payment associated with the start of construction. The result is extremely poor labor productivity for a variety of reasons, such as poorly ordered work and re-work.
IPA’s research uncovered another interesting advantage of split-form: projects that make extensive use of modularization exhibit even more pronounced cost advantages. This observation was significant because prior IPA studies had not indicated cost benefits for modularization under any other contracting approaches. Ed concludes that the savings associated with modularization must end up with the contractor under lump-sum or EPCM arrangement, whereas the split form allows the savings to benefit the owner [vi].
Why utilize split-form when lump-sum EPC is readily accepted by financiers?
It is NER’s experience that industrial projects comprising new technologies struggle to find a willing counterparty for a lump-sum EPC contract. The key concern we hear about is that the contractor is reluctant to take on the lump-sum construction cost risk. Many contractors are more willing to agree to a lump-sum contract for the engineering and procurement only. Essentially, there are very few firms willing to work on a lump-sum EPC basis, and even fewer where a new technology is involved. The split-form approach opens the doors to more counterparties willing to contract on a lump-sum basis for a partitioned scope and, furthermore, can actually deliver better results overall as demonstrated by the IPA dataset – it can provide more cost certainty than a EPCM or a reimbursable EPC contract structure and may realistically be the only way for some projects to move forward.
Key challenges when utilizing split-form contracting
There are challenges associated with the split-form method that may represent significant roadblocks for unsophisticated developers. Foremost among them is that the project developer needs to understand construction management and select the construction company. For many technology developers, their first commercial scale plant may be their first experience of managing the construction of a large industrial site. This will require the owner team to hire employees with these necessary skills and put in place the necessary management systems. The construction management does not need to be performed by the owner, but they will need to be more involved than they would with a lump-sum EPC contract and will need to staff the project appropriately. A general contractor can be hired to perform the day-to-day construction management for the owner organization but will require close involvement of the owner’s project managers.
Structuring the contracts in a split-form is not trivial. There needs to be a well-defined division of responsibilities between the firms related to commissioning, startup, and performance testing. The schedules and associated guarantees need to be carefully coordinated to ensure the engineering and procurement deliverables are available when needed for the construction contractor. The liabilities need to also be coordinated in a way that covers all the risks effectively and places the responsibility on the correct counterparty. Both the EP firm and the C firm need to offer liquidated damages related to hydraulic performance. Thermal performance guarantees need to be offered by the EP firm at least, and maybe the construction firm as well. Any construction problems discovered during commissioning (after Mechanical Completion) need to be the responsibility of the construction firm and should be linked to their schedule guarantees. Chemistry guarantees may be picked up by the EP firm, but it is more likely that the chemistry guarantees will only be forthcoming from the technology licensor and be passed directly to the owner. As a result, the penalties from the technology licensor will be small compared to the overall project value.
The way the performance guarantees are split and shared between multiple parties will give pause to many financers. The splitting of these guarantees will also reduce the liquidated damages available for any underperformance. A performance insurance product from New Energy Risk can be used to effectively “wrap” all these performance guarantees and provide the performance certainty needed by many capital sources.
An experienced perspective on split-form project execution
To gain an experienced perspective on how to execute on a split-form contract in a project finance transaction, I reached out to Antoine Schellinger, Executive Vice President of Project Operations & EPC at Citroniq. Antoine agreed that a correctly executed split-form project would “materially reduce the cost of project implementation,” but added that there are many challenges that need to be carefully managed to make it possible (many of those are mentioned in the previous section). He suggested the following example of how to execute a project by implementing the following split-form structure in place prior to a final investment decision (FID):
- Execute a lump sum EPF (engineering, procurement, and module fabrication) contract. The fabrication contract can be separated from the EP contract, and according to Ed’s book there are significant cost advantages for doing so.
- Execute a ‘good faith’ construction contract with an estimated cost based on estimated quantities, but with all commercial terms and conditions firm.
- Convert the construction contract to lump-sum when drawings are ‘Issued for Construction’ based on actual quantities.
- Hold a calculated equity reserve to account for growth in the construction contract that accounts for every reasonably foreseeable growth allowance (there are excellent historic metrics available).
The reason to delay the finalization of the lump-sum price on the construction contract is that final engineering drawings and accurate material costs are not available for the construction contractor at FID. As a result, the construction contractor will need to include a significant “risk premium” on the price if the lump-sum price is finalized at FID. Waiting to finalize this price can significantly reduce the risk premium and reduce the overall cost to the project.
Making split-form contracting ‘bankable’ for project financing
An important question for the energy transition and project finance ecosystem is whether the advantages of a split-form contracting approach can be adopted into project finance transactions. A key component to project finance is contracted cost certainty, which is why the lump-sum EPC contracting method is preferred (despite a high frequency of cost overruns, especially in poorly defined projects). While split-form contracting may be effective in reducing costs, it must be done in a way that also provide project financers with confidence that complete project scope is contracted at a fixed price. There must be complete confidence that these contracts, when combined with the owner’s contingency, enable the project to be completed within the project budget.
In NER’s view, financial institutions should consider a carefully structured split-form project as an alternative to lump-sum EPC, especially considering all the advantages it offers. Despite the multitude of benefits, there may be unsophisticated, or “check the box,” financers that are unwilling to invest in a split-form contracting project. To move the many projects forward that are needed to transition our economy to a more sustainable one, financers will need to learn more about split-form contracting and how it is executed effectively. Project developers will carry the same burden, carefully developing projects in a way that lowers capital costs while also providing the cost certainty that the finance markets require. In support of split-form contracting, NER is well positioned to help overcome the performance guarantee challenges that are unique to this contracting structure and is one of the many ways that we are Underwriting a Greener Future®.
Works Cited
[i] Merrow, pg. 56
[ii] Merrow, pg. 75
[iii] Merrow, pg. 65
[iv] Merrow, pg. 68
[v] Merrow, pg. 106-107
[vi] Merrow, pg. 107-108

NER Releases its 2022 Sustainability Report
Sustainability is at New Energy Risk's core. Our business model delivers performance insurance solutions to a wide range of energy technologies and related infrastructure projects and technologies that have a major impact on our world, from reducing emissions, to creating more sustainable fuels, to finding new uses for municipal and industrial wastes, to new models for low-carbon transportation. We help drive these technologies to scale and foster greater customer adoption to accelerate a more sustainable society.
We are proud of our clients, who are committed to solving some of the world's most pressing environmental issues. Collectively, they are reducing that quantity of waste sent to landfill and building a circular economy, reducing dependence on aging centralized power grids, reducing transportation’s dependence on petroleum, and preventing harmful greenhouse gas emissions.
Read NER's latest sustainability report from our CEO, Tom Dickson, Chief Actuary and Managing Director of Underwriting Development, Sherry Huang, Senior Scientist, Shawn Lee and Manager of Business Development, Richard Riley. The report details the sustainability impacts of NER’s client portfolio, where innovations to reduce carbon intensity for fuels and power as well as to promote the circular economy and curb waste have delivered impact by multiple measures.

Can the US Look to the East for Lessons in Wind Deployment?
By Britti Paudyal
Taiwan is implementing an ambitious program of offshore wind development and has had to take some bold steps to make it happen. Meanwhile, the US aims to achieve similar goals.

When I began my education in Climate Science at Minerva University, an undergraduate program based in San Francisco that takes me to seven different countries over four years, I expected that my learnings in Cleantech advancements would be concentrated mostly in the US and in Europe. Flying over the wind-turbine-clad coasts of Taiwan, I realized that my Eurocentric misconceptions about the state of the renewable energy transition in Asia were unfounded. My semester living on the beautiful island of Formosa sparked my curiosity to learn more about Taiwan's efforts in deploying wind to clean up its energy industry.
Taiwan, a strong US ally in Asia, boasts one of the world's largest hardware industries and a population of 23.5 million who enjoy an exceptional (and carbon-rich) quality of life. The country has a carbon footprint of 12 metric tons of CO2 per capita, only slightly lower than the American average of 16 tons [1]. With regards to sustainability-related attitudes and climate action, the nation boasts incredible amounts of public green space, highly reliable and efficient public transport, and ranks second globally in residential recycling, only after Germany.
Despite these successes, Taiwan's energy sector lags behind. With 98% of its energy coming from imported oil and gas from the Middle East, Taiwan faces the energy trilemma — a threat to energy security, affordability, and sustainability. Fossil fuels not only contribute to climate change and harm human health but also expose the isolated Taiwanese grid to significant risks of power shortages. Persistent tensions in the Gulf may manifest in shipment delays and supply shocks that could greatly impair Taiwan. Formosa is making strides toward cleaning up their energy industry considering these vulnerabilities and striving for greater energy independence [2].
Recognizing the potential for deep waters and coasts to harness wind power, Taiwan is leveraging the expertise of European wind developers to deploy multi-billion-dollar offshore wind projects up to 60 kilometers into the Taiwan Strait. Prominent off takers for these projects include TSMC, the world's largest contract chipmaker and Taipower with 20-year guaranteed Power Purchase Agreement (PPA) contracted at a fixed rate. Major wind energy builder Orsted from Denmark developed the Greater Changhua 2b and 4 projects, totaling 920 MW, reported to be the world's largest corporate offshore wind purchase power agreement [4] [3].
These undertakings have not come easy. To carry out offshore deployment, Taiwan undertook a risk-reward analysis, specific to their own situation. They have confronted barriers to implementation comparable to the US. In 2012, Taiwan enacted a comprehensive three-phase, 20-year “Thousand Wind Turbines Project” with a clear road map towards achieving 40-55 GW of offshore wind by 2050. Taiwan is amending its laws to allow wind farm construction up to 60 miles into deep waters, despite territorial risks from Beijing. Additionally, regulatory changes that allow foreign investors to own 100% of wind power stocks have been crucial to attract investment, accelerating the vast amounts of financing required for wind deployment [4,5].
There are many similarities between Taiwan and the US. President Biden aims to deploy 30 GW of offshore wind in the US by 2030, which presents significant opportunities to clean up the energy industry, create jobs, and spur investment across the supply chain. However, wind developers in the US face unique regulatory challenges. Although proposed wind energy projects total 18GW – over half the projected requirement to meet the 2030 offshore wind goals – the permitting process for wind construction on federally protected waters remains lengthy, burdensome, and ambiguous [6]. The Bureau of Ocean Energy Management (BOEM) follows a four-phase process for offshore wind construction, including planning (2 years), leasing (1-2 years), site assessment (5 years), and construction and operations (2 years). In total, this process takes at least 10 years [7]. Although the Biden administration introduced the National Environmental Policy Act (NEPA) Energy Permitting Reform to streamline the onerous federal, state, and local requirements for projects, these changes will take time to come into effect after the approval of the debt ceiling bill [8].
The Jones Act of 1920, a century-old law that requires only US-built, crewed, and flagged ships to transport cargo within the country, poses a unique obstacle to offshore wind projects [9]. Passed after World War I to protect the critically strategic US maritime industry, the law now hinders offshore construction by forcing project developers to charter from a pool of 32 turbine installation vessels under the EU flag at a rate of up to $180,000 a day and to perform logistical feats to avoid landing at US ports [10]. As an example of unforeseeable consequence, the Act has become a barrier to domestic and international trade, resulting in inefficiencies and missed opportunities for growth.
To install offshore wind turbines in deep waters, specialized vessels costing over half a billion dollars are required [11]. To avoid the restrictions of the Jones Act, Dominion Energy developed its own 14,000-ton steel vessel at a cost of $500 million to install the country’s first full-scale commercial offshore wind farm [11]. Between four and six additional specialized installation ships are needed to meet the 2030 offshore wind goal of 30 GW, which requires the construction of 2100 turbines [11]. Developers are hesitant to build these vessels due to their high cost and the need for constant demand over decades to recoup the initial investment. The Jones Act, along with the lengthy permitting and approval process of NEPA and BOEM, highlights the need for solutions to work around or adjust policies that impede offshore wind deployment.
Taiwan's pipeline of 11 offshore wind farm projects totaling 5.7 GW by 2025 is a stark contrast to the United States' mere two operational farms (Block Island Wind Farm in Rhode Island and the Costal Virginia Offshore Wind pilot facility in Virginia). Taiwan is achieving its goal thanks to its ambitious national targets, swift regulatory amendments, and willingness to collaborate with foreign developers such as Orsted, using vessels such as Seajacks Scylla, who deployed the 111 wind turbines for the Changhua 1 and 2a offshore farms (900 MW) [13,14]. The US has much to learn from Taiwan's offshore wind success, which highlights the importance of integrating ambitious objectives and billions of dollars in funding with streamlined project approvals, permits, and regulatory changes to allow for efficient utilization of global industrial capacity or the development of domestic capability [12].
References
[1] Knoema . (n.d.). Taiwan Province of China CO2 emissions per capita, 1970-2022 - knoema.com. Knoema. Retrieved August 21, 2023, from https://knoema.com/atlas/Taiwan-Province-of-China/CO2-emissions-per-capita
[2] Hou, E. A. F., Jen-yi, & Hou, E. A. F., Jen-yi. (2020, April 27). Overcoming Taiwan’s Energy Trilemma. Carnegie Endowment for International Peace. https://carnegieendowment.org/2020/04/27/overcoming-taiwan-s-energy-trilemma-pub-81645
[3] Wu, S. (2023, May 10). Taiwan’s wind industry braves cross-strait risks in clean energy boom. Reuters. https://www.reuters.com/business/energy/taiwans-wind-industry-braves-cross-strait-risks-clean-energy-boom-2023-05-10/
[4] Davies, N., Julien, B., & Rebbapragada, A. (2020, October 30). Industry seeks to replicate Taiwan wind success throughout Asia | Global law firm | Norton Rose Fulbright. Www.nortonrosefulbright.com; Petroleum Economist – Energy Transition Newsletter. https://www.nortonrosefulbright.com/en/knowledge/publications/1f7442e2/industry-seeks-to-replicate-taiwan-wind-success-throughout-asia#section1
[5] Chiang, Y.-M. (2023). The Legitimacy and Effectiveness of Local Content Requirements: A Case of the Offshore Wind Power Industry in Taiwan. Springer Climate, 119–133. https://doi.org/10.1007/978-3-031-24545-9_8
[6] US DOE. (2022, August 16). Offshore Wind Market Report: 2022 Edition. Energy.gov; Office of Energy Efficiency & Renewable Energy. https://www.energy.gov/eere/wind/articles/offshore-wind-market-report-2022-edition
[7] Gov, B. (2020). The Renewable Energy Process: Leasing to Operations. https://www.boem.gov/sites/default/files/documents/renewable-energy/Leasing-Process_0.pdf
[8] Nilsen, E. (2023, May 24). What is permitting reform? The critical energy provision buried in debt-ceiling negotiations | CNN Politics. CNN. https://www.cnn.com/2023/05/24/politics/energy-permitting-debt-ceiling-climate/index.html#:~:text=Energy permitting reform could rethink
[9] Duncan, C. (2023, April 3). The Jones Act: How a 100-year-old law complicates offshore wind projects. Spectrumlocalnews.com; Spectrum News 1. https://spectrumlocalnews.com/nc/charlotte/news/2023/04/03/the-jones-act--how-a-100-year-old-law-complicates-offshore-wind-projects#:~:text=The current guidance on the
[10] Grabow, C., Manak, I., & Ikenson, D. (2018, June 28). The Jones Act: A Burden America Can No Longer Bear. Cato Institute. https://www.cato.org/publications/policy-analysis/jones-act-burden-america-can-no-longer-bear
[11] Shields, M. (2023). Supply Chain Road Map for Offshore Wind Energy in the United States. Www.nrel.gov; National Renewable Energy Laboratory.
[12] Hu, A. (2023, July 11). Biggest offshore wind farm in the US gets the go-ahead. Canary Media. https://www.canarymedia.com/articles/wind/biggest-offshore-wind-farm-in-the-us-gets-the-go-ahead
[13] Kuo, J. (2021). Taiwan Offshore Wind Farm Projects Update. Www.jonesday.com; Jones Day. https://www.jonesday.com/en/insights/2021/08/taiwan-offshore-wind-farm-projects-update
[14] Durakovic, A. (2022, April 1). First Turbine Stands at Greater Changhua 1 & 2a Offshore Wind Farm. Offshore Wind. https://www.offshorewind.biz/2022/04/01/first-turbine-stands-at-greater-changhua-1-2a-offshore-wind-farm/
An Exciting Week in Material Science
By Shawn Lee.
Some intriguing claims by Korean superconductor researchers hold lessons ion the importance of verification in academia and in industry.
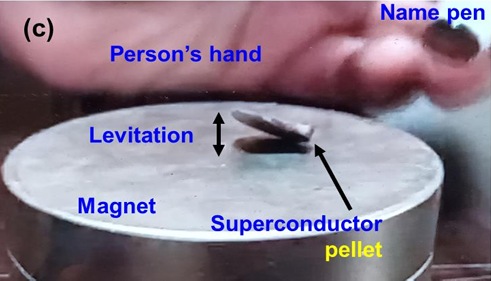
Alleged partial levitation of an LK-99 sample [1]
On Friday afternoon, three Korean researchers released two pre-prints (draft papers not yet reviewed by third party peers or editors) claiming to have made a superconductor that works at room temperature and pressure [2]. This is an exciting claim; superconductors can conduct electricity without any resistance or loss. In theory, these materials could dramatically increase the efficiency of electricity transmission and electronics, low-friction transport, nuclear fusion, and quantum computing. In practice, all currently published superconducting materials only show their special properties at very low temperatures. In 2021, the highest temperature superconductor was a fragile cuprate of mercury, barium, and calcium at -140C.
Assessing claims of high temperature superconductivity in public is similar to how we assess claims of technical performance at New Energy Risk. Like many exciting developments, the record around this possible discovery is still emerging. The original papers were the product of a collaboration between a university professor and industrial R&D postdocs. One of the original two papers drafts was recalled, and the author who originally brought it to the public turns out had been fired a while ago. The industrial partners may have held back key parts of the manufacturing recipe, or at the very least released a substantially non optimal study [3].
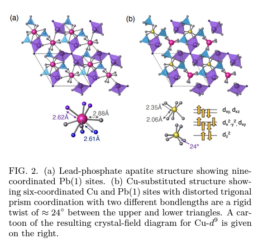
There are two aspects of a technical claim that need to be validated. The first is theoretical: is the claim possible under the laws of physics, and under what conditions? The second part is empirical: can we show with data that this really happened? On the theoretical side, the original paper speculated, without quantum-mechanical simulations, that adding trace amounts of copper caused the material structure to deform enough to create superconducting states. On Monday, teams from Argonne National Lab and Northwest University in Xi’an both ran density functional theory quantum simulations that showed two possible reasons why room temperature superconductivity could be possible with materials in the original paper [4]. This is interesting because prior to this, superconductors generally came from altered conductors, whereas the base material before copper addition here, apatite, is an insulator, and both papers showed that while the superconducting state is possible, it competes with non-superconducting states and is not preferred.
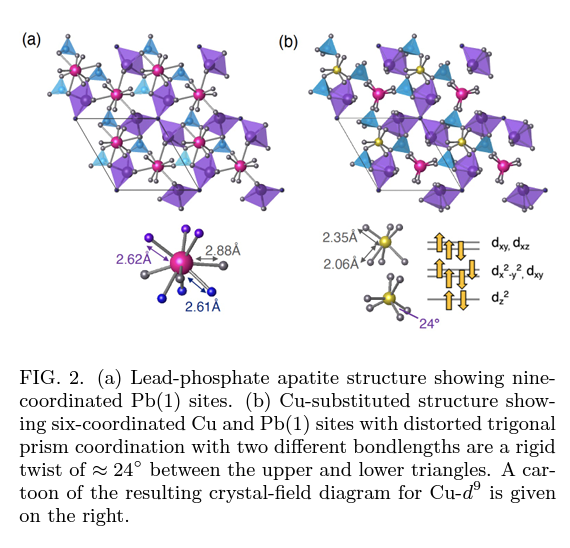
Simulated distortions by substituting Copper centers [5]
On the experimental side, the original papers did not actually measure zero electrical resistance or the full expulsion of the magnetic field from the material that would be key signs of superconductivity, but did include partial levitation on top of a magnet, which could indicate regions of superconductivity at room temperature. Unlike most other superconducting candidates, these materials can be produced over the course of days. The fanciest piece of equipment necessary is a chemical vapor deposition chamber, which is common in most semiconductor labs and means that we should have results from third parties within a week.
The first experimental results from third parties are a mixed bag. The first one in pre-print, from Beihang University, showed no sign of superconductivity at room temperature as claimed, while claiming a purer version of the material than the original Korean papers [6]. Other results announced, but not written up, show mixed results ranging from optimistic to no noticeable effects at all, with the most optimistic case showing as zero resistance at 110K (well below the originally advertised transition temperature) [7]. Nothing, including the original papers, has been peer reviewed, but even that’s not a guarantee. In 2022, another team’s high temperature superconducting paper had to be retracted from Nature after publication because of falsified data.
Between the theory and the mixed bag of early experimental results, it’s certainly interesting enough to continue investigating. My guess right now is there may be some local states which may display some superconducting characteristics, but the difficulty in isolating those regions may make replication harder than in other materials. As the picture of what’s actually happening in these materials emerges, we see similar themes to how NER underwrites any new technology: we make sure it’s physically possible at least in theory - even if the precise causal mechanism is unknown - and then we make sure that key claims have been validated experimentally by third parties, and that the method reporting is sound and consistent with best standards.
That’s clearly not yet the case here. There are probably years of process engineering improvements and characterizations before a verified discovery becomes an insurable commercial technology, but this is a reminder of the importance of verification procedures, both in academia and in industry.
Cited Works
[1] https://arxiv.org/ftp/arxiv/papers/2307/2307.12037.pdf
[2] https://arxiv.org/ftp/arxiv/papers/2307/2307.12008.pdf
[3] https://www.tomshardware.com/news/superconductor-breakthrough-replicated-twice
[4] https://arxiv.org/abs/2307.16892 and https://arxiv.org/abs/2307.16040
[5] https://arxiv.org/pdf/2307.16892
[6] https://arxiv.org/abs/2307.16802

A Guide to Gasification - How Gasification Is Paving the Way for Sustainability
By Brad Price.
New Energy Risk helps accelerate the commercialization of industrial technologies that are solving global challenges. One of the technology platforms which we frequently review is gasification. This important process contributes to the production of low-carbon fuels and the development of a more circular economy, and we are proud to help our clients bring it to commercial scale.
What is Gasification?
Gasification is a natural topic to follow my last blog post, A Primer on Pyrolysis, since it is the next step on the scale of thermal deconstruction chemical processes, shown in Figure 1.
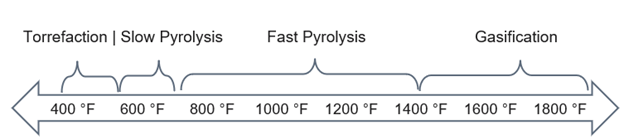
Figure 1 – General temperature ranges of thermal deconstruction chemistries
Gasification is a process of partial oxidation (think partial combustion) that occurs above about 1400 °F (760 °C). It is used to convert a solid feedstock (like coal or biomass) or a liquid feedstock (like petroleum products), into synthesis gas (otherwise known as ‘syngas’). The key source of oxygen for the partial oxidation is usually either air, purified oxygen, or steam (via the “O” in H2O). The amount of oxygen supplied is significantly less than is required to completely burn the feedstock. Synthesis gas is primarily composed of carbon monoxide (CO), hydrogen (H2), and methane (CH4). 'Synthesis' (or 'synthetic') is in contrast to 'natural' gas, which is naturally occurring. Syngas and was historically produced from coal before petroleum-based natural gas was available.
Whereas pyrolysis results in a partial deconstruction of the feedstock, gasification can be considered a near-complete destruction of the feedstock into its most basic building blocks. It utilizes the brute force of intense heat and oxygen to break nearly all the chemical bonds in the feedstock; few other chemical processes operate at a higher temperature.
When fed with biomass feedstock, the gasification process can produce renewable, low-carbon fuels, chemicals, and various other products. Using biomass (like wood, grass, or other organic matter) as a fuel source is considered low-carbon and renewable because the carbon emitted during the combustion process is offset by the carbon that the plants absorb during their lifetime through photosynthesis. This carbon is normally returned to the atmosphere as CO2 during the natural decomposition process (i.e., rotting). This carbon is instead returned to the atmosphere when the gasification products are burned as fuel, doing useful work, and since the next generation of plants will absorb the same amount of carbon it creates a closed carbon cycle.
Another beneficial way to use gasification is when a waste stream is used as a feedstock, such as plastic waste, municipal solid waste (trash), or wastewater treatment sludge. Gasification can give new life to these materials. By using waste as a feedstock, gasification helps to reduce the amount of waste sent to landfills or incinerators, which can help to decrease greenhouse gas emissions and environmental pollution. Additionally, gasification can provide a local source of energy and reduce the reliance on fossil fuels, thereby contributing to energy security and promoting sustainable development. Overall, the use of waste in gasification allows for a more ‘circular’ economic system, where waste is repurposed and/or reused, rather than a straight-line path from production to disposal. This approach can help to reduce waste, conserve resources, and promote a more sustainable, circular economy.
Is Gasification New?
 Far from it – gasification has a long history. As early as the 1820’s, the streetlights in England were fueled using synthesis gas (also known as “town gas”) from coal gasification plants. They were referred to as “coal distillation” plants and were operated to maximize the production of liquid tars; an important precursor to the burgeoning fabric dye industry (1). It is difficult to overstate the impact of this gaseous fuel byproduct of coal distillation on the day-to-day life of those who were able to access it because it was cleaner and more practical than other energy sources. Synthesis gas played a key role in the energy mix in the UK until the 1970’s, during which period 13 million homes were transitioned from synthesis gas to natural gas (2) This transition was a monumental undertaking that required the conversion or replacement of each and every town gas fueled appliance. It is fair to say that gasification and synthesis gas played a significant role in the industrial revolution.
While gasification is not new, in many places it has been replaced by other more efficient fuel sources like natural gas. The story in the UK was repeated around the world as natural gas presented a much more energy dense alternative to synthesis gas as a fuel, and much less toxic due to the lower content of carbon monoxide. Despite this, it has never quite gone away.
A modern example of gasification is China’s chemicals industry. China has built an extensive chemicals and fuels industry on a foundation of coal gasification. While China is limited in its petroleum resources, its coal resources are vast. The National Energy Technology Laboratory (NETL) has documented over 100,000 ton/day of aggregate capacity for coal gasification in China, with over 70,000 ton/day capacity under construction (as of 2014). This capacity is used to produce base chemicals and products such as ammonia, methanol, synthetic natural gas, hydrogen, liquid fuels, DME, olefins, and plastics (3).
What Does Gasification Produce?
As mentioned earlier, gasification primarily produces a synthesis gas composed of carbon monoxide (CO), hydrogen (H2), and methane (CH4). Generally, however, this is not the final product or purpose of a gasification plant. The “magic” of syngas is the fact that it can be converted into so many different useful products.
Figure 2 below shows many of the different product pathways from a gasification plant. In addition to power, these include naphtha and diesel produced via Fischer-Tropsch Liquids, methanol, ethylene and propylene, hydrogen, ammonia, and many other products. As a result of these numerous pathways, gasification can be viewed as an alternative way of producing virtually every chemical that can be produced from petroleum-based feedstocks.
In addition to syngas, gasification produces small quantities of tars. “Tar” has a long history in the development of Organic Chemistry in the 1800s but has generally been poorly defined and is less important today. It is a mixture of high-viscosity aromatic compounds that can foul downstream equipment if not properly accounted for.
There can also be a carbon or coke product from gasification. This can be thought of as charcoal, although its properties can be somewhat different. The amount of coke produced depends greatly on the operating conditions and the feedstock composition.
Another undesirable byproduct of gasification is ash. Ashes are created due to contaminants in the feedstock that cannot be gasified, such as metallic and salt impurities. Depending on the operating temperature of the gasifier and the composition of the ash, this ash can melt or “slag.” Controlling the slagging conditions is important in all gasifiers.
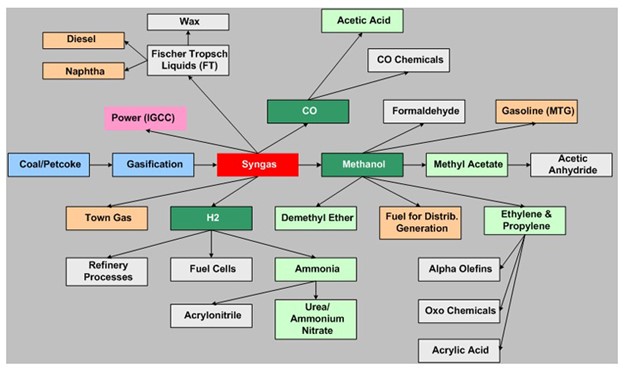
Figure 2 – Chemical pathways from gasification (4)
What is New in the Story of Gasification?
Much like pyrolysis, recent innovation in gasification is related to feedstock. While coal has been industrially gasified for over 200 years, there are many feedstocks that had never been successfully gasified at scale until recently.
A perfect example of this is Fulcrum BioEnergy. Their Sierra BioFuels Plant gasifies municipal solid waste to produce syngas, which is then liquified using Fischer Tropsch technology to produce synthetic crude oil. Producing synthetic crude oil by gasification of municipal solid waste had never been done at scale before this facility. New Energy Risk partnered with Fulcrum Bioenergy in 2017 by providing a customized technology insurance solution to increase project attractiveness to investors (5). Fulcrum announced that in December 2022 the Sierra site had produced its first barrels of synthetic crude. (6)
In addition to municipal solid waste, many other feedstocks are being considered for gasification, including agricultural wastes and byproducts, wood, sewage sludge, and food production byproducts.
What Is the Business Case for Gasification Today?
Gasification is always an upgrading process, meaning it transforms lower priced feedstocks into higher value products. The products are generally commodity base chemicals or fuels. Since base chemicals all have the same product qualities, a competitive advantage cannot be obtained on the product side. As one might expect then, competitive advantage in gasification is related to the feedstock. Gasification’s business case is strongest when there is a financial advantage due to either a low-cost feedstock or a feedstock that is renewable or recycled, providing additional value to the products. Gasification represents a key pathway to low-carbon fuels and recycled materials.
Many of the business models New Energy Risk has seen are built around biomass as a feedstock for gasification. The material may be low-cost waste streams from other industrial or agricultural processes. The target products qualify for biofuel credits that then receive a Renewable Identification Number (RIN) and/or qualify for the Low Carbon Fuel Standard (LCFS) credits, which can be extremely lucrative, especially when used in transportation applications.
An advantage of gasification is that it tends to be able to handle feedstocks that are more contaminated (“dirtier”) and therefore less expensive to procure. This reiterates the importance of feedstock on the business model because a low-cost, contaminant-heavy feedstock is the ideal case for a successful gasification business model that can compete with other technologies.

Figure 3 - Gasifier types Source: Wikipedia
Another advantage is on the product side. As shown in Figure 2, gasification can be a precursor to many different chemical products. This flexibility tends to surpass any other chemical process. For example, pyrolysis only yields a crude-oil like product and requires further processing into higher-value products. This allows the gasification business model to be built around a low-cost or advantaged feedstock on the front end and pick from a wide range of products on the back end to maximize the total value created by the asset.
What Are the Challenges for Gasification?
Nothing is easy about innovation. To design a reliable (and profitable) process, technology developers must identify and mitigate many issues that are unique to each technology. Unfortunately, innovative technology projects frequently fail. Even with proper piloting, innovative process technologies on average only achieve ~80% of the design production rate six months after startup. Without proper piloting, this number is closer to 50%. (7)
The first challenge area for gasification is solids handling. Solids handling can be the bane of an innovator’s existence. While mundane, it oftentimes causes significant reliability issues. The feedstock and the coke and the ash byproducts are oftentimes sticky or otherwise difficult to convey and can cause mechanical problems due to buildup on the inside of the equipment. The equipment tends to require additional maintenance when compared with equipment in liquid or gas service. Spare equipment is oftentimes required to handle the outage time associated with these activities.
Tar formation represents a challenge to all gasification processes. When cooled, this material can polymerize and deposit on downstream equipment, resulting in significant plugging of equipment and downtime to clean it. Technologies exist that destroy these tars at extremely high temperatures, or chemically react them to more stable components. Every gasification plant needs to have a plan that has been field tested to handle these compounds.
Slagging is an issue for both slagging and non-slagging gasifiers. For slagging gasifiers, the ash needs to melt. This will require monitoring of the melting point and potentially adding material that ensures all the ash melts and ends up in the slag stream. These are some of the hottest gasifiers available, resulting in more technology risk because of these severe conditions. For non-slagging gasifiers, the ash needs to be monitored to ensure that it does not melt. For example, in a non-slagging fluidized bed gasifier, if the ash starts to melt, the entire fluidized bed can collapse, and then require a jackhammer to remove the agglomerated bed material from the gasifier. The feedstock is the primary determining factor of the ash melting point, so it is important for developers to fully understand the melting point of the ash in their feedstock.
How Can New Energy Risk Help with Your Gasification Process?
Financing an innovative gasification process can be a challenge, due to the risks associated with innovative technology. NER is positioned to provide performance insurance solutions to protect capital providers if the technology does not perform as expected. NER’s in-depth diligence process and innovative technoeconomic modeling allows us to quantify the risk associated with projects deploying these technologies. We have over a decade of experience enabling developers to de-risk their project and attract capital at terms that are impossible to achieve without insurance.
An example gasification client of ours is Fulcrum. NER was able to assist Fulcrum by helping to provide a performance insurance solution to protect bondholders in their project debt financing. In 2017, Fulcrum was able to secure $175 million in debt capital (bonds), and NER’s insurance product helped to improve the interest rate on those bonds by 2% annually. Construction at the site has completed, and the Fulcrum team announced in December 2022 that the site had begun production of their synthetic crude oil. (6)
Gasification is just one example of the innovative technologies that we evaluate and support at NER. This is part two in our series that takes a closer look at some of these innovations. Next up: A Teaser on Torrefaction.
Works Cited
[1] Aftalion, Fred. A History of the International Chemical Industry. Philadelphia : Chemical Heritage Foundation, 2001.
[2] Office for Budget Responsibility. Decarbonising domestic heating: lessons from teh switch to natural gas. [Online] July 2021. [Cited: March 13, 2023.] https://obr.uk/box/decarbonising-domestic-heating-lessons-from-the-switch-to-natural-gas/.
[3] Nathonal Energy Technology Laboratory. China Gasification Database. [Online] July 2014. [Cited: March 14, 2023.] https://netl.doe.gov/research/coal/energy-systems/gasification/gasification-plant-databases/china-gasification-database.
[4] Nathional Energy Technology Laboratory. 12.1. Overview: Chemicals From Gasification. [Online] [Cited: March 14, 2023.] https://netl.doe.gov/research/carbon-management/energy-systems/gasification/gasifipedia/chemicals.
[5] New Energy Risk. Case Studies. [Online] [Cited: March 14, 2023.] https://newenergyrisk.com/case-studies/.
[6] Fulcrum Bioenergy. Fulcrum Bioenergy Successfully Produces First Ever Low-Carbon Fuel from Landfill waste at its Sierra BioFuels Plant. News and Resources. [Online] December 20, 2022. [Cited: March 14, 2023.] https://www.fulcrum-bioenergy.com/news-resources/first-fuel-2-2.
[7] Andras Marton, Ph.D. Getting Off on the Right Foot - Innovative Projects. Independent Project Analysis Newsletter. March 2011, Vol. 3, 1.
The Evolving Advanced Recycling Supply Chain - The Importance of an Industry Feed Specification
By Krista Sutton.
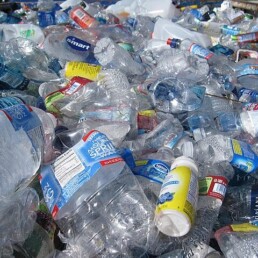
New Energy Risk helps accelerate the commercialization of industrial technologies that are solving global challenges. One of the technology platforms that we see increasingly is pyrolysis technology being deployed in the development of a more circular plastic economy. A key challenge for those developing these projects is securing a bankable feedstock agreement for waste plastic. This challenge is magnified by the fact that the industry has not developed a standardized feedstock specification for pyrolysis of waste plastic.
The Big Picture
Increasing awareness of the extent of plastic pollution and the focus on sustainability are creating demand for recycled material in consumer products. The market incentives are growing and come from many different sources including consumer preferences and a willingness to pay a premium for recycled products, plastic taxes, corporate pledges, recycling mandates, single use plastic bans or taxes, extended producer responsibility programs, upsets in the global supply chain following China’s national sword policy [8], subsidized local recycling programs, and increased landfill fees to name a few.
Today the recycling value chain largely consists of mechanically recycling (sorting, shredding, washing, drying, grinding, melting, granulating, and compounding) diverse plastic streams to produce recycled granules that can replace virgin plastic granules in the manufacturing of some plastic products, notably not always the same plastic products that the recycled products came from as there are stringent restrictions on products like food grade packaging.
Advanced recycling involves technologies that break down plastics at a chemical level to monomers that can be fed into petrochemical plants to make new polymers. Such advanced recycling technologies are currently being commercialized. However, today’s supply chain for waste plastics has evolved to meet the needs of mechanical recyclers and not advanced recyclers. With advanced recycling scaling up there is a need to understand the overlap and the differences in feedstocks for these processes and how the supply chain might look different in the future.
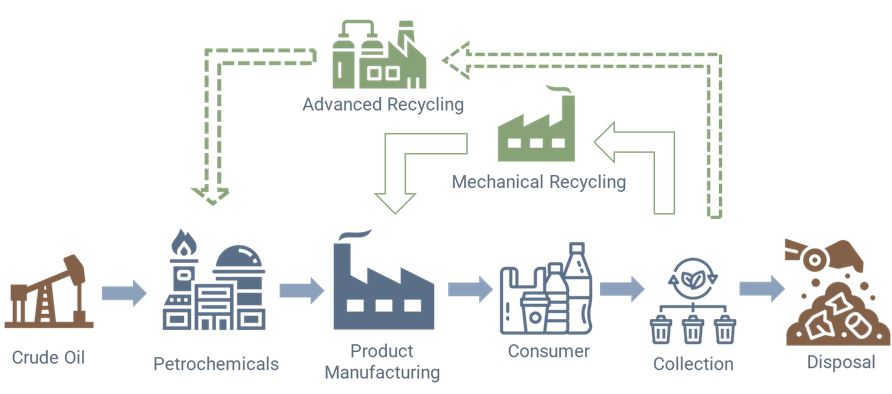
Figure 1 – Generic plastic value chain [10], [11], [12], [13], [14]
How Does Pyrolysis Fit In?
Pyrolysis, while not a new process in other industries nor the only process used for advanced recycling, is new to the waste plastic space and is the leading technology in this developing sector. For a quick refresh on the pyrolysis process read Brad Price’s blog post A Primer on Pyrolysis. Currently, there is no standardized feedstock specification for plastic pyrolysis, which can create challenges for startups and other businesses in the plastic supply chain.
As pyrolysis technology scales there are a couple key factors driving supply chain and value chain development.
- What pyrolysis product quality can the customer (downstream petrochemical plants) accept?
- What streams of plastic are available in large quantities on a consistent basis that can be processed to meet those customers’ demands?
The main product of pyrolysis of plastic is a liquid stream (pyoil) that is either sold with or without being separated into different boiling ranges and fed to existing processes in the petrochemical industry that make monomers for new plastic products. Perhaps not surprisingly, the downstream processes in the petrochemical industry along with pyrolysis plant operability considerations will dictate the quality of the pyoil and limit the acceptable levels of containments allowed in the pyrolysis feed streams.
To complicate matters, the current infrastructure setup for collection of waste plastic via mechanical recycling at Material Recovery Facilities (MRFs) will dictate the availability of the different types of feed.
A Proposed Waste Plastic Feedstock Specification
The Alliance to End Plastic Waste, a global non-profit whose mission is to end plastic waste in the environment and invests in innovative waste management solutions, conducted a study surveying current pyrolysis operators about their feedstock streams and contaminants. Aggregating all the responses provides a good starting point for an industry specification to show what is being processed today and to start the conversation on what plastic waste streams could be targeted going forward, and how waste managers might change their operations to meet growing pyrolysis feed demand. This specification shows that pyrolysis can handle more contaminants than mechanical recycling but there are still restrictions. One of the key specifications is the PVC/PDVC content, which needs to be kept to a minimum for corrosion mitigation while also acknowledging that, with current sorting technology for waste streams, it cannot be eliminated entirely. Another key specification concerns organic contaminants, providing guidance on how much post-consumer plastic can be accepted by pyrolysis operators and a target to help drive down organic contaminants in post-consumer plastic waste streams in the future so that more post-consumer material can be recycled.
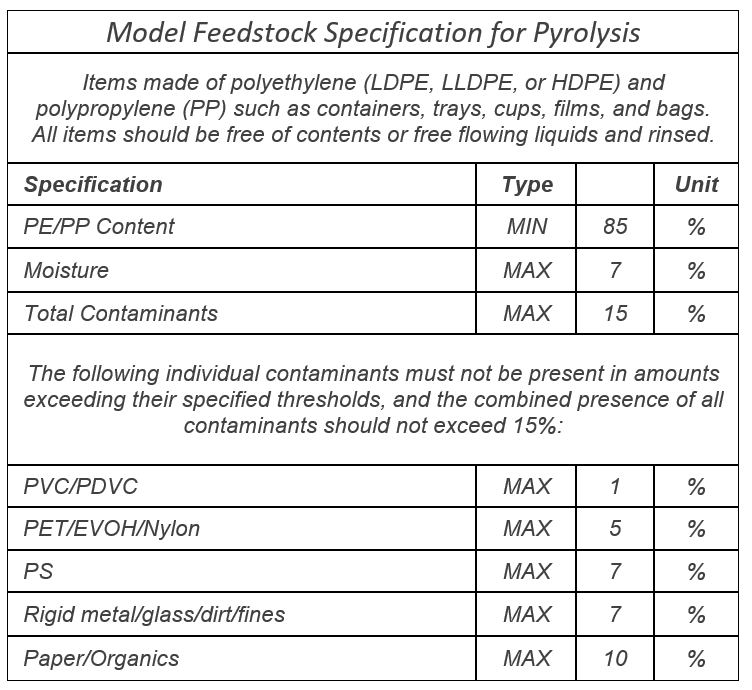
Figure 2 – From Feedstock Quality Guidelines for Pyrolysis of Waste Plastic published by Alliance to End Plastic Waste August 2022 [1]
For more details on each plastic type see the Appendix below.
Individual pyrolysis operators will vary specs based on economically available feed material in their location, different restrictions of their pyrolysis technology and equipment at the plant, and differing customer expectations and restrictions so this represents a generalized target that conveys trends in the industry.
Why Is a Feedstock Specification Important?
There are overlapping feedstock streams between mechanical recycling and pyrolysis plants, and both benefit from consistent, well sorted and cleaned feed streams, although the purity and contaminant restrictions for mechanical recycling are more stringent. As a result, pyrolysis brings some advantages and opportunities:
- Ability to process mixed and colored PP and PE streams
- Ability to process multi-material plastics (PP/PE mixed films with small amounts of aluminum, PET, PVC, EVOH, or nylon contaminants)
- Ability to process feed streams with more organic contaminants, which is a major barrier to increasing the amount of post-consumer plastic that is mechanically recycled.
- Ability to process feeds that have historically been uneconomic to mechanically recycle (PS and LDPE/HDPE films)
- Ability for the product to be integrated into existing petrochemical supply chains and comingled with virgin plastic feedstock materials.
- Ability to supply food grade and medical grade applications, avoiding downcycling common in mechanical recycling applications due to decreased mechanical integrity of the material from contaminants and added thermal and mechanical stress during melting and reextrusion.
There are also some drawbacks; mainly the energy intensity, the highly-trained workforce needed to operate pyrolysis plants, and the yield (it is not possible to recover 100 percent of the recycled plastic feedstock as new plastic products). These drawbacks mean that pyrolysis is best placed as a complementary solution to mechanical recycling; able to accept streams that are rejected from MRFs but still fit within specified contaminant limits for pyrolysis. Pyrolysis can also be used for end-of-life plastics that can no longer be mechanically recycled and plastic streams that have historically not been collected because there has been no economically viable way to mechanically recycle them (e.g. films, multi-material products, polystyrene etc).
A waste plastic pyrolysis plant feed specification is a starting point in communicating to all the participants in the plastic value chain which plastic resins can be targeted by pyrolysis operators. Such a specification will change with new advancements and growth in the circular plastic sector.
A feed specification for pyrolysis will impact, and will in turn be informed by:
- Expansion and advancement in collection of waste plastic as additional recycling infrastructure is built
- Sorting at MRFs that are transforming to accommodate and optimize both advanced recycling and mechanical recycling feed quality requirements as well as implementing advanced sorting technologies (ex. Infrared spectroscopy, hyperspectral imaging, florescence imaging, or use of markers and tracers)
- Optimization of pyrolysis plant yields, product quality, and operability
- Technical innovation in pre- and post-pyrolysis treatment technology to treat contaminants
- Product recipes, as manufacturers start targeting higher and higher percentages of recycled material and responding to new requirements from customers and regulatory bodies to incorporate end of life in product design
- Market development and transparency; sellers and buyers would have a standard to compare different material and price, which provides the larger financial markets with more understanding of waste plastic as a resource. Transactions will become more efficient and transparent with increasing understanding of value chain drivers and opportunities for further investment
- Collaboration of government, private business, research, and other parties, leading to more informed policy, technological advancement, quicker scaling, increased efficiency, increased transparency, and increased sustainability throughout the value chain
Going forward, the chemically recycled plastic value chain is likely to evolve iteratively with market dynamics and technological advances but progress starts with a shared understanding of what can be recycled and how it can be recycled most economically.
Further Reading – How Are Plastics Classified?
To understand how this specification came about, let’s dive in and look at the different plastic resins in the context of pyrolysis and mechanical recycling. Plastic goods are classified by Resin Identification Codes (RICs), which are used somewhat consistently internationally and printed or embossed on plastic products. It is a common misconception that these symbols mean the plastic product is recyclable when, in reality, it’s a mark to identify what specific type of plastic a product is made from.

Figure 3 – Resin Identification Numbers [3]
Polyethylene Terephthalate (PET): PET (the ubiquitous plastic water bottle) is recyclable but must be segregated as its own stream to be mechanically recycled by grinding, cleaning, and remelting back to pellets. Pyrolysis processes can take a limited amount of PET because it introduces oxygen into the process, which can be problematic as it produces high yields of gases and char which are not circular products and are uneconomic to make use of. There is ongoing development on some other chemical recycling processes for PET involving different process reactants, catalysts, and operating conditions, but in all cases, PET needs to be segregated from other plastics and is therefore not a candidate for mixed plastic pyrolysis feed.
High Density Polyethylene (HDPE): Rigid HDPE (food and cleaning product containers) is recyclable and does get collected, sorted, and mechanically recycled today. However, a lot of this material gets rejected at the MRFs due to organic contamination, color, or other additives, and ends up in the landfill. HDPE is an acceptable feed for pyrolysis and the pyrolysis process is more forgiving of contaminants, making the HDPE rejected from mechanical recycling an ideal feedstock for pyrolysis.
Polyvinyl Chloride (PVC): PVC (pipes, lawn furniture, hoses, window frames) is not collected from household curbside service but there are specialty businesses that will recycle it at certain drop-off locations. The main issue with PVC and the reason it is considered a contaminant in most mechanical and chemical recycling processes is the high chlorine (Cl) content and the additives that are used in PVC manufacturing. PVC in pyrolysis feed should be minimized as Cl forms hydrochloric acid (HCl) and in the presence of water will cause corrosion in the plant and transport infrastructure. Cl is also a catalyst poison in downstream petrochemical processes. PVC can be mechanically recycled although it is difficult due to the special formulations and additives in each PVC product, which means each PVC product would have to be separated from other PVC products to maintain quality and usefulness of the recycled material (ex. only the same formula PVC pipes could be recycled into new pipes, only the same types of PVC hoses could be mechanically recycled into new hoses etc)
Low Density Polyethylene (LDPE): LDPE (squeeze bottles, film packaging for food) is generally not recyclable through curbside service although some locations will accept it. LDPE plastic bags (shopping bags) are not recycled through curbside pickup. There are receptacles for LDPE bags at grocery stores but usage of this collection system remains low, meaning that most plastic bags are not recycled and end up in landfills. Plastic bags need to be segregated from the mechanical recycling supply chain because they will jam machinery in sorting facilities. However, there is no issue with LDPE as a feedstock for either mechanical recycling or pyrolysis. LDPE is an opportunity for both mechanical and chemical recycling but must overcome the economic barriers of segregated collection and preparation.
Polypropylene (PP): PP (pallets, bottle caps, jars, bumpers, plastic bins, straws etc.) is recyclable through regular curbside service and is a main feedstock for mechanical recycling. This is also a main feedstock for pyrolysis and is accepted in pure or mixed streams if containments are low enough.
Polystyrene (PS): PS (packing peanuts, coffee cups, takeout containers, etc.) is not readily recycled in current mechanical recycling plants and not collected and aggregated through curbside recycling programs. Pyrolysis of polystyrene is still early in commercialization but is being processed by pyrolysis operators today despite the underdeveloped supply chain.
Others: Polycarbonate (PC), Acrylic plastics (ex. ABS), Polyamide (Nylon): Largely considered as contaminants in both mechanical and chemical recycling and not collected for recycling through curbside programs with very few exceptions.
Works Cited
[1] Gendell, Adam, and Vera Lahme. Feedstock Quality Guidelines for Pyrolysis of Plastic Waste. Eunomia, Aug. 2022, p. 43, https://endplasticwaste.org/-/media/Project/AEPW/Alliance/Our-Stories/Feedstock-Quality-Guidelines-for-Pyrolysis-of-Plastic-Waste.pdf?rev=44dca58903154225b453b358c80c4dc3&hash=3D9ADC9211C4DE44ED8E0F2B87A3ACBE
[2] Resin Identification Code (RIC) | Environmental Claims on Packaging: A Guide for Alameda County Businesses. http://guides.stopwaste.org/packaging/avoiding-pitfalls/resin-identification-code.
[4] Chemical and Mechanical Recycling Can Coexist. Will They? 16 Sept. 2022, https://www.ptonline.com/blog/post/chemical-and-mechanical-recycling-can-coexist-will-they-
[5] StackPath. https://www.recyclingtoday.com/news/greenback-chemical-mechanical-recycling-coexist-europe-uk/. Accessed 28 Mar. 2023.
[6] Circular Plastics | Economist Impact. https://impact.economist.com/sustainability/circular-economies/inside-the-circle-circular-plastics. Accessed 28 Mar. 2023.
[7] What Can Go in Your Curbside Recycling Bin? | LoadUp. https://goloadup.com/what-can-go-curbside-recycling-bin/. Accessed 28 Mar. 2023.
[8] Brooks, Amy L., et al. “The Chinese Import Ban and Its Impact on Global Plastic Waste Trade.” Science Advances, vol. 4, no. 6, June 2018, p. eaat0131. DOI.org (Crossref), https://doi.org/10.1126/sciadv.aat0131.[9] Mangold, H. and von Vacano, B. (2022), The Frontier of Plastics Recycling: Rethinking Waste as a Resource for High-Value Applications. Macromol. Chem. Phys., 223: 2100488. https://doi.org/10.1002/macp.202100488
[9] Mangold, H. and von Vacano, B. (2022), The Frontier of Plastics Recycling: Rethinking Waste as a Resource for High-Value Applications. Macromol. Chem. Phys., 223: 2100488. https://doi.org/10.1002/macp.202100488
[10] Petrochemical icons created by Eucalyp - Flaticon
[11] Waste icons created by noomtah - Flaticon
[12] Oil refinery icons created by maswan - Flaticon
[13] Plastic icons created by photo3idea_studio - Flaticon
[14] Landfill icons created by Umeicon - Flaticon

Building a Better Backstop
11 Considerations for Project Sponsors Comparing Government Backstops and Private Sector Solutions
By Matt Lucas, PhD; Managing Director, Business Development
At New Energy Risk (NER), we cheered the recent announcement that clean energy leader and icon Jigar Shah would be leading the DOE’s Loan Programs Office (LPO). We share his goal of seeing the office streamlined to maximize its effectiveness. We have interacted with both DOE and USDA loan guarantee programs for multiple years and have first-hand experience: One of my colleagues led his former company’s successful LPO application process.
Given the need to deploy hundreds of billions of dollars to meet climate mitigation goals, create post-pandemic jobs, and commercialize frontier technologies, there’s room for all sources of capital. We hope this post will inform project sponsors and highlight factors to consider when evaluating their project financing options.
Coverage Triggers: Key Differences Between Government and Private Solutions
It is important to understand how government loan guarantees and private-sector solutions work in a downside scenario. Although similar in intent—both solutions protect project lenders—the mechanism of coverage is different, which has significant impacts on project owners, equity investors, workers, and other stakeholders.
For government loan guarantees, the project is expected to exhaust all its contingencies, maintenance reserve, and debt service reserve in the event of revenue shortfalls. If the project is unable to meet its debt service obligations after these measures, then the project would be in Default (with a big ‘D’) of the loan. To recover its investment, the lender is required to foreclose on the project and liquidate the assets. The bank is then audited by the government and only then does the government pay the bank for the portion of the debt it was unable to recover. Project owners and equity are on the outside looking in, with their investment completely wiped out.
The impacts of this are severe: The sponsor and all equity has been zeroed out, the project has been shuttered and liquidated, and the technology has suffered a very public failure that will be adverse to any future financings. The government might have succeeded in making the bank whole (notwithstanding the challenging liquidation and audit processes), but every other stakeholder has been thrown to the wolves, the technology will not be commercialized, and the carbon mitigation and jobs co-benefits go unrealized.
NER has a better solution that ultimately protects the lender while also benefitting other project stakeholders. We also help protect capital at risk, including but not limited to senior debt. While there are efficiencies in time and cost ahead of financial closing (see considerations below), the key difference is that our solutions are designed to avoid a lender default, preserve the project, and secure a cure. Unlike the government loan guarantees, which provide after-default support to the bank, we step in earlier to support the project and avoid a default in the first place. While the insurance might directly benefit a lender, this design also benefits subordinate and equity investors who would otherwise be washed out and workers who would lose their jobs, and gives the technology a chance to be improved and repaired. NER could be compared to a standby lender, providing necessary liquidity to project sponsors to service debt while enacting cures or fixes to restore project health.
11 Considerations for Project Sponsors When Comparing Backstops
Total Cost of Debt
The cost of debt is more than the cost of capital: Government capital is probably the cheapest option on the market, but this is often balanced by other advantages of private debt. As Jigar noted on a trade group call, “[LPO] is a commercial bank so we price where the banks should price. We are not subsidizing capital.” Jigar provided a median estimate for an all-in cost of debt from LPO of 5.5-6.0%, based on a fixed cost of capital from Treasury around 2.0%.Bank or bond borrowing, when coupled with insurance solutions such as NER’s, can provide comparable pricing. As of this writing, 10-year Treasury (1.66%) and BBB spread (1.15%) leave a private cost of capital (2.81%), near the LPO’s cost from Treasury. With 300+ bp of spread for the lender and insurance, it is possible to provide private-sector senior debt on similar terms. Our clients Fulcrum BioEnergy closed on over $100M in financing on 20-year notes in 2017 at 6.25% and Brightmark (formerly RES Polyflow) closed on 20-year paper at 7% in 2019.
Time to Close
There is always a rush to get projects financed. A bank loan can close in three months. A bond offering might take four to five months. NER can close in as little as three months.The government works on a different timescale. Jigar acknowledged that timelines for LPO can be long and he’s working to streamline that. Historically, projects have had to march through a multi-stage process that routinely drags on for a year or more. Anecdotally, one of our clients just took 4.5 months to receive back their initial review.
Underwriting Fees
In his recent podcast, Jigar said that typical underwriting and closing fees (outside the risk premium) are $2M. These fees must be borne by a project even if a closing is never achieved and are accrued prior to receiving a term sheet. For this reason, LPO is most appropriate for larger loans. Anecdotally, one of our clients incurred more than twice this cost just to reach a term sheet (not yet closed).By contrast, NER’s fees for underwriting and closing are more than an order-of-magnitude lower. While LPO can defer and even waive fees, the process is uncertain, while we require no similar efforts.Another distinction is when third-party reports are due, such as market reports and the independent engineering report (and must be paid for by the sponsor). LPO requires these documents prior to offering a priced term sheet. By contrast, a private lender would only require the reports as a condition for financial close. By delaying these transaction costs for the sponsor, private lenders align costs with certainty of reaching financial closing.
Certainty of Closing
Sponsors seek to de-risk their projects and increase certainty. NER has a decade-long track record of delivering The Power of Certainty™ to our customers. 100% of our engaged clients have received priced term sheets and 100% of accepted term sheets have resulted in approved policies.The government has additional requirements that increase execution risk. These include a “policy factors” review by Office of Management and Budget, minimum credit ratings for key counterparties, required credit rating opinion on the project, and in some cases a National Environmental Policy Act (NEPA) review, which can take up to 24 months.
International Expansion and Capital Limitations
Government loan guarantees only support projects in the US and have limits on how many projects of a certain type they will support. Since it takes five to eight years of robust operations to achieve bankability without a government or private backstop, LPO’s limitations can impact domestic growth after project one or international growth. NER can support your entire portfolio, both domestically and abroad. Having a single partner with a single diligence for your entire portfolio smooths execution.
Covenants and Other Restrictions
Loan agreements include standard covenants that ensure good project governance, but additional covenants can be constraining to sponsors in a detrimental way. LPO covenants include dividend restrictions, made-in-America requirements, and qualifications on equity sponsorship. These are not typical of private lending and are not required by NER.
Flexible Capital Structures
NER supports a variety of capital structures including senior debt, mezzanine and sub-debt, tax equity, preferred equity, and combinations of the above. Government loan guarantees are limited to senior debt. We can support other capital tranches, in conjunction with government guarantees, if it makes sense to do so.
A Partner, Not a Bank
NER aims to be your partner in executing your project. In the last few months, we’ve leaned in to connect our clients with EPCs, lenders, equity investors, bankers, and LCA consultants. LPO, as a governmental agency, is restricted in its ability to make connections to key counterparties due to confidentiality concerns and the need for the government to remain neutral.
Project-Level Workout Vs. Bank-Level Guarantee
A government loan guarantee is designed to pay the lender in the event of a loss but does not help avoid the project default in the first place. In contrast, NER seeks to avoid a lender default from occurring by stepping in sooner and achieving an early workout at the project level. This approach is advantageous for the project, benefitting subordinate investors and workers, and allowing the project to return to operational and financial health.
Amount of Debt Capital Required
If a project requires more than $1B of debt capital, then working with a government program is the right choice. However, most first- or first-few-of-a-kind projects require vastly less debt, making a government program less attractive. In any case, larger projects are often best structured as multiple phases/tranches to segment risk, which also allows for private backstops.
Offtake Risks
LPO works with public dollars and helps projects ensure commercial risks are minimized, while often being overly conservative and going beyond levels that the private market would bear. Previously, LPO urged fixed priced offtakes, which are not available for some projects. Jigar shared that LPO will now consider indexed offtakes with Renewable Fuel Standard (RFS) and Low-Carbon Fuel Standard (LCFS) credits for bioeconomy projects, which is promising. NER will work with projects that have commercial risks acceptable in the private markets. We routinely support projects without fixed priced offtakes. In the bioeconomy, offtakes rarely match the debt terms and are typically indexed rather than fixed price, and can be heavily dependent on RFS or LCFS revenues. In some circumstances we can also hedge these credit prices.
Thinking about how to fund your project? New Energy Risk is often the first partner aligned to help with the financing of a project, so we serve as a sounding board and advisor to sponsors as they consider their multiple capitalization pathways. We look forward to partnering with you to help your project achieve funding.
###

Carbon Capture: 11 Highlights From the Finalized 45Q Rules
A summary of key points from the 187-page final regulation
By Matt Lucas, PhD; Managing Director, Business Development
I’m excited about carbon capture technology; it’s critical for decarbonizing hard-to-electrify industrial infrastructure and other facilities whose emissions are challenging to mitigate. So, like many others, I’ve been waiting for the IRS to release its final carbon capture regulations on 45Q, the federal tax credit.
After nearly three years of anticipation, we finally have both the regulations and the IRS’s commentary. As then-Treasury Secretary Mnuchin said, “These final regulations provide taxpayers and the American energy sector with needed clarity on utilizing the section 45Q credit.” Finally!
For carbon capture to continue to iterate, scale, and improve, it needs non-recourse project financing and the traditionally conservative tax equity community to come to the table. Tax equity is critical for monetizing 45Q.
There’s a great deal to glean from the IRS guidance, but I would guess most people don’t have the time or patience to sift through its 187 pages. Here’s your cheat sheet: I’ve summarized the key points, which collectively provide the additional clarity and certainty that investors need to invest in carbon capture.
11 Takeaways from the 45Q Final Guidance:
- Removing the Cap: One of the key reforms to the 45Q regulation was to lift the 75 million ton cap on credits. However, the cap still applies to qualified carbon capture facilities placed in service before February 9, 2018 (i.e. before the reform was passed). In the interim, several 45Q credits have been ‘disallowed’—IRS-speak for ‘revoked’ because the taxpayers claiming them were not complying with the regulations. The IRS clarified that those disallowed credits will be returned to the 75Mt pool. To keep track, the IRS publishes an annual running tally (page 925) of claimed credits and will continue to do so until the cap is reached. In June 2020, 72,087,903 credits had been claimed, so I suppose the cap will be hit soon, even with the exclusion of the disallowed credits, and this annual report will then become irrelevant.
- Clarifying Who Gets the Credit: Some carbon capture projects (including many of the early demos) were vertically integrated from capture through geologic storage, so there was no question about who could claim the tax credit and who had responsibility for secure storage. However, this becomes more complicated when the capture and storage are completed by different parties. The IRS ruled that the credit belongs to the party that owns the capture equipment, and only they can elect to transfer the credit. Furthermore, the owner of the capture equipment may be different than the owner of the industrial facility, which the equipment is capturing from. This is important for carbon capture entrepreneurship; third-party capital can be brought to existing emitting facilities that don’t understand carbon capture but still want to benefit from the emissions reduction.
- Contractually Ensuring CO2 is Stored (Sort of): Beyond ownership, a greater complication is the contract between the capture company and the storage company. After all, if the storage company leaks the CO2, the capture company would be the responsible entity in the eyes of the IRS, since they were awarded the tax credit. The IRS thoughtfully allows for multiple CO2 storage contracts, as well as a string of contracts (say from a general contractor to subcontractors), but has only minimal rules about what liability the storage company is required to take on (“must include commercially reasonable terms and provide for enforcement of the party’s obligation”). As business hates ambiguity, I think this is a prime opportunity for investment-grade insurance solutions, like those from New Energy Risk, which can indemnify the capture company against leakage from storage.
- Timing the Credit: Legislation states the 12-year period for claiming the credit starts when the equipment is originally placed in service. Some rejected comments sought to stretch the timeline, by delaying the ‘Placed in Service’ date to account for MRV plan approval or a commissioning ramp-up period. The current policy design rightfully incentivizes the fastest possible commissioning schedule.
- Lifecycle Accounting Is Only for CO2: Some CO2 utilization pathways mitigate greenhouse gases other than CO2, and mitigation may be greater than the Qualified Carbon Oxide directly utilized. To comply with ISO 14044:2006, the IRS required lifecycle analysis reports (LCAs) to ensure the overall carbon utilization process was reducing greenhouse gas emissions, but expressly limited those LCAs to account for carbon oxides only for purposes of the tax credit. The credit volume is capped by carbon oxides that are captured rather than also including those that are mitigated. This is an admittedly messy area with many different processes. In particular, there are issues with defining system boundaries, defining a baseline, and verification generally. Overall, I doubt any of this nuance will contribute meaningfully to overall credit volumes since geologic storage projects will be much larger.
- Defining Carbon Capture Equipment: Earlier drafts from the IRS had attempted to list the included and excluded equipment, which turned out to be confusing given the diversity of carbon capture technology and processes. The final regulations allow for inclusion of all equipment related to carbon capture up to the point of transportation.
- What Is an Electric Generating Facility: One would think this is obvious, but some facilities, like combined heat and power facilities, may sell incidental electricity to the grid even if power generation isn’t their primary purpose. Many are not large enough to meet the 500,000 ton per year minimum requirement. The IRS defines these facilities by their MACRS asset classes, which are used in calculating depreciation. Since MACRS classes are well defined, this should put to rest any questions about which facilities have to meet the higher minimum capture volumes of an Electric Generating Facility.
- Holding the Line on Tough EOR Regulation: The IRS appropriately held firm that enhanced oil recovery (EOR) operations had to have their MRV plans or ISO certifications in place before claiming the 45Q credit and could not do so on a provisional basis.
- Expansively Defining a ‘Qualified Carbon Capture Facility’: A previous IRS document, Section 8 of Notice 2020-12, provided a broad definition for how to define a Qualified Facility. I applaud the IRS’s flexibility, allowing projects that share some features including:
- common ownership
- common loan agreement were planned under the same FEED study
- share common operations and management
- share infrastructure
- are part of the same contractual offtake
- are combined in regulatory permits and reporting
- and/or are proximally located to qualify as a single unit.I see no compelling reason to disqualify facilities solely for being too small. Technoeconomics will dictate a minimally viable facility size, but I see no reason for the IRS to put its thumb on that scale. However, Placed-In-Service requirements will still require any distributed projects to be commissioned simultaneously, which I think will limit the utility of this broad definition. - Slammed the Door on Photosynthesis and Soils as “Direct Air Capture” and “Secure Disposal”: For proponents of photosynthesis and soil carbon as climate solutions, ‘direct air capture’ sounded like plants and regenerative agriculture sounded like ‘secure storage.’ The IRS rejected these comments and preserved the Congressional intent of the tax credit to support ambient capture facilities and geologic storage in deep formations, not soils.
- Lookup Period is Shortened: Any CO2 leakage is deducted on a last-in, first-out basis. Earlier rules provided a five-year lookback period for ensuring geologic storage, but the IRS shortened this to a three-year period. Class VI storage sites are not exempt from recapture requirements. The shorter lookup should be helpful as it lowers the compliance burden on the taxpayer. Insurance solutions from New Energy Risk can mitigate this further.
If you have additional questions about 45Q, we’d be happy to hear from you. Here at New Energy Risk, we are geared up to play a substantial role in helping to scaling new carbon capture technologies. So for us, the finalization of 45Q is the bedtime reading we’ve been waiting for. And now we can finally get some rest.
###

IRS Rules for 45Q Tax Credit Clear Path for US Carbon Capture Projects
By Dr. Matt Lucas, Managing Director, Business Development
At New Energy Risk, we’re excited about carbon capture technology, which is critical for hard-to-decarbonize industrial infrastructure. For carbon capture to continue to iterate and improve, it needs non-recourse project financing and the traditionally conservative tax equity community to come to the table. Tax equity is critical for monetizing the US federal tax credits like 45Q.
45Q is available for 12 years to incentivize carbon capture technology deployment for utilization, enhanced oil recovery, and geologic sequestration. To help attract tax equity, NER’s technology risk performance insurance solutions are a critical part of the desirable financial infrastructure. NER's solutions are specifically tailored to the needs of carbon capture to address concerns about technology performance, credit recapture, and financial responsibility for geologic storage.
As we’ve talked with project developers, we’ve noted that 45Q has presented almost as many questions as answers, which has lead to project paralysis.
Luckily, as of May 28, the IRS has finally provided responses to many project developers’ longstanding uncertainties surrounding 45Q, so that these projects can proceed with the required certainty to make use of the 45Q tax credit.
In the rest of this article, we’ll summarize the key takeaways of that update and get a bit into the weeds.
45Q Reform and Updates as of Early 2020
45Q was reformed in 2018, increasing its value and removing a limit on the number of credits available, which had created uncertainty and stifled the utilization of the credit. Congress left many details to be determined by the IRS in a rulemaking process, which the IRS opened to the public in Notice 2019-32.
During this rulemaking, the clock was already ticking since the reformed 45Q statute includes a Commence Construction deadline of January 1, 2024. The carbon capture community was stuck in a catch-22: rushing to meet the construction deadline while lacking clarity on how the tax credit would be implemented. Then earlier this year, the IRS issued two guidance documents, Notice 2020-12 and Revenue Procedure (RP) 2020-12, which addressed a few of the many outstanding questions left by Congress on how to implement 45Q.
Notice 2020-12 included:
- Definition of ‘Commence Construction’ to include both ‘Physical Work Test’ and ‘5% Safe Harbor’ pathways, analogous to other renewables tax credits
- Allowance of a safe harbor for a continuous construction period of six years, which compares favorably to the four years for wind and solar
The RP 2020-12 included details about permissible partnership structures, including that the partnership does not need to generate cash revenues. Normally, business transactions may not be completed solely for the purpose of a tax benefit. However, in the case of carbon capture with geologic storage, the only revenue is the 45Q tax credit. Importantly RP 2020-12 explicitly allows for insurance (like New Energy Risk’s solutions) to be used to ultimately mitigate investor risks.
So, What Just Happened?
On May 28, 2020, the IRS issued REG-112339-19, which finally answers all of the major remaining questions:
- Recapture of tax credits in the event of CO2 The recapture period begins with the first injection of CO2 for geologic disposal and ends five years after the last claim of a 45Q credit or when monitoring ends, whichever comes first. Recapture will operate on a last-in/first-out basis beginning in the current tax year. For storage sites supplied by multiple projects, the leakage is allocated on a pro-rata basis. The guidance explicitly allows for recapture insurance (which New Energy Risk could support).
- Credit transfer is a unique aspect of 45Q that allows the capture equipment owner to elect to transfer the credits to other taxpayers within the carbon capture partnership. Credit transfer is complementary to tax equity investors, allowing 45Q credits to be allocated to project partners with tax liability or to be monetized by conventional tax equity investors. The IRS allows for an election each tax year for all or a portion of the tax credits to be assigned to one or several claimants.
- Protocol for carbon accounting for utilization. The IRS requires a lifecycle assessment (LCA) by a licensed, third-party firm consistent with ISO 14044:2006 standards. The LCA must account for all greenhouse gases, which means that carbon utilization projects can use 45Q to monetize savings in both CO2 and other, more potent greenhouse gases.
- Protocol for secure geologic storage. It’s important that CO2 stored underground stay there. Two types of wells can be used to accomplish this. Class VI wells, used only for CO2 storage, already require compliance with an EPA regulation called Subpart RR, and that reporting will be accepted by the IRS. The IRS decision to accept EPA reporting saves work for project operators. The other type of well, called Class II, is used in enhanced oil recovery. Operators may opt into reporting to the EPA under Subpart RR or use a new international standard for CO2 storage, the ISO 27916:19 standard. However, state and tribal reporting will not be accepted.
The rule also helpfully and expansively defines ‘Carbon Capture Equipment’ broadly to include all the equipment used for capture, treatment, and preparation of the carbon oxides, but excludes the transportation and disposal/injection/utilization equipment. The rule also defines a ‘Qualified Facility’ in the context of industrial sites where some equipment is pre-existing. The IRS applied the 80/20 rule, whereby the site qualifies if 80%+ of the capital equipment is new.
As more carbon capture projects start up, aided in part by 45Q and the IRS’s new guidelines, we’re very excited to see the industry advance through proof of performance and scale. To get there, NER can play a key role in supporting project financing. If you’re involved in a carbon capture project and we haven’t spoken yet, please give us a call so we can discuss opportunities to partner.
###